

 Log In
 Register
 Home
Home

 Topic RSS
2:51 pm

March 9, 2016
 Offline


This is a made up statistical analysis for the efficiency of an offense under a quarterback. I made it up. I’m pretty sure nobody else has something exactly like this. It’s a basic system, but it works to show how an offense progresses under a particular signal caller. If somebody else has done something like this before (which is likely), sorry not sorry for copying it.
First, let me explain
I want to say that this is indeed different that a quarterback’s rating. This doesn’t go through yardage totals and completions or how well they ran the ball. This analysis goes through how efficiently the offense progressed under each quarterback. Allow me explain just how my new metric works. It’s a fairly rudimentary and crude approach to seeing how efficient an offense runs under a certain quarterback, but it’s also a fairly quick, and somewhat effective method to see just how well a quarterback can lead an offense.
So, the method is fairly simple. I scrolled through the drive charts from Saturday’s Maroon and White game to see how many drives a quarterback led and how the drive ended. I broke up the ending into five different categories and assigned each of them a point value that I multiplied by the amount of times a drive ended in that fashion.
The categories and point values are as follows: 1) punting which is multiplied by -0.5. It’s not the worst way to end a drive but it’s not great either. 2) Turnover on downs or offensive turnover, multiplied by -1. This is more to see how efficient the offense was, not necessarily the quarterback. 3) Quarterback turnover, multiplied by -2. It’s not good for a quarterback to turn the ball over. 4) Offensive touchdowns, multiplied by 1. This is pretty self explanatory, right? An offense scores, it’s efficient. And finally 5) quarterback specific touchdowns, multiplied by 2. Quarterbacks are rewarded here with a higher point total because they were responsible in some manner for the touchdown, be it by passing, running, or catching in a trick play.
Let’s jump into the numbers, shall we?
All of the below tables are from screenshots from an excel spreadsheet where I did all of my (very basic) calculations.
First, let’s look at just how each drive ended under each quarterback:
![]()
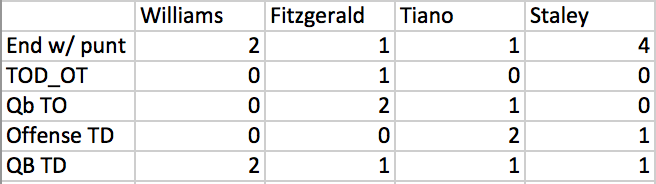

Just a quick reminder that TOD_OT stands for turnover on downs or offensive turnover, Qb TO is quarterback turnover, and QB TD is quarterback touchdown.
This data is very straightforward and pretty much just highlights how each drive ended for each quarterback. Of note, Damian Williams had four drives, both Nick Fitzgerald and Nick Tiano had five (I’m not counting the single play drive that featured two MSU legends. That drive doesn’t count) and Elijah Staley had six. So, as a whole, my sample size is admittedly small. I’m not working with much here since I’m only using the spring game. But these guys haven’t had lengthy careers with multiple starts, so it’s not like I have much more to go on.
Here’s the percentages for how each drive ended for each quarterback:
![]()
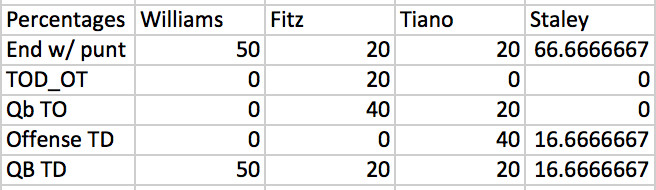
Pretty easy to understand everything so far, right? Damian Williams had a 50/50 split of how his drives ended while the other guys had more variation in their results. And now, we’re going to start doing some multiplication from our set of raw data to start compiling the efficiency data.
![]()
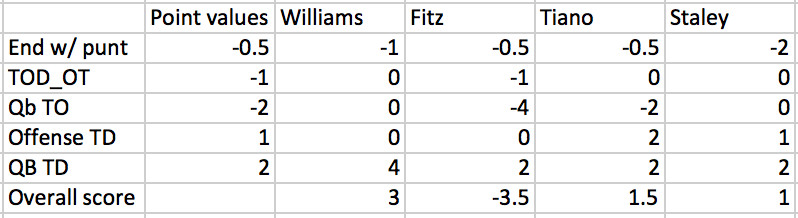
All of the values are added in here. The columns show the point values that each quarterback accumulated for each category of how the drives ended and the overall score for their “Ethan Lee’s Quarterback Efficiency Metric” is shown at the bottom.
And so, what are we seeing here?
First of all, when Damian Williams ran the offense, it progressed at a much cleaner rate than every other quarterback. The offense didn’t turn the ball over when he was on the field, and all of his drives ended in either a punt of a touchdown, specifically a couple of scores that he was responsible for. He showed that he could manage the offense well, and statistically he was rewarded here.
Behind him comes Nick Tiano, who had a bit of a “boom or bust” set of results when he was leading the offense. Many have remarked about how eye catching Tiano was, and he performed incredibly well, particularly for a redshirt freshman. And the offense was fairly efficient under him. He did throw an interception, but his ability to run through defenders and throw the ball with some speed did lead the offense to the most amount of cumulative touchdowns with three while he was on the field.
Elijah Staley comes in third here, just behind Tiano. Staley benefitted from having the most time on the field with six drives but the offense struggled for most of those, punting four times. Staley’s offense was, like the one Williams ran, turnover free when it was on the field, with it getting two total touchdowns, one with Staley catching it.
And Nick Fitzgerald rounds out the bunch here with a score of -3.5. Many have already talked about his overall struggles as he threw two picks, but it should be noted that the offense was also stopped on fourth down, which is something not totally in his control.
So, what should we make of this?
Well, you really can’t make too much of this. The sample size is small and this method doesn’t reflect totally on a quarterback’s abilities. Plus, we’ve seen every quarterback struggle at certain times throughout the spring, this is just looking at the spring game. But, it should be noted that the offense performed considerably better under Damian Williams on Saturday.
Many have counted the redshirt junior out of the competition, saying that he’s bound to transfer to a smaller school. I don’t think that’s the case. These numbers, and Dan Mullen’s comments about how it’s still open for anybody to win show that Damian has as much of a chance as the other guys on the roster. There’s very little separation between the quarterbacks, so it’ll be interesting to see how the battle progresses into the summer and fall.
1 Guest(s)
